Kirjaudu sisään Inderes Free -tilillesi nähdäksesi kaikki sivun maksuton sisältö.
Nibe Industrier
56,94 SEK −5,48%133 sijoittajaa seuraa yhtiötä
Nibe Industrier is an industrial company. The company offers services in heating solutions and energy management. The Group's operations are divided into a number of business areas and subsidiaries, each with special expertise. The company has customers on a global level with the largest concentration in the Nordic region, Europe and North America. The products are focused primarily on corporate customers and larger institutes, but also on private individuals. The company is headquartered in Markaryd, Sweden.
Lue lisääP/E -luku (24e)
25,97
EV/EBIT (oik.) (24e)
21,42
P/B -luku (24e)
3,88
Osinkotuotto % (24e)
0,97 %
Tavoitehinta
56.00 SEK
Suositus
Vähennä
Päivitetty
19.2.2024
NASDAQ Stockholm
NIBE B
Päivän matalin / päivän korkein hinta
56,88 / 60,34
SEK
Markkina-arvo
114,79 mrd. SEK
Vaihto
516,47 milj. SEK
Vaihtomäärä, kappaletta
8,9 milj.
Riskitaso ja suositus
KorkeaRiskitasoMatala
MyySuositusOsta
Kirjaudu sisään nähdäksesi Inderesin suosituksen ja riskitason
Viimeisimmät analyysit
Laaja raportti
Inderesin laaja raportti on syvällisin asiakasyhtiöstämme tehty tutkimus.
Uusin laaja raportti on julkaistu
Lue raporttiAnalyst

Lucas Mattsson
Analyytikko
Pörssikalenteri
Yhtiökokous
16.05.2024
Osavuosikatsaus
16.05.2024
Vuosittainen osinko
17.05.2024
Osavuosikatsaus
16.08.2024
Osavuosikatsaus
15.11.2024
Suurimmat omistajatLähde: Millistream Market Data AB
| Omistaja | Osuus | Ääniä |
|---|---|---|
| Current and former board members and senior executives | 45,9 % | 45,9 % |
| Schörling | 18,7 % | 18,7 % |
Inderes Premium
Tämä sisältö on vain Inderes Premium -käyttäjille.
Tuloslaskelma
| 2020 | 2021 | 2022 | 2023 | 2024e | 2025e | 2026e | 2027e | |
|---|---|---|---|---|---|---|---|---|
| Liikevaihto | 27 146,0 | 30 832,0 | 40 071,0 | 46 649,0 | 47 084,1 | 50 100,5 | 53 476,8 | 57 088,5 |
| kasvu-% | 7,1 % | 13,6 % | 30,0 % | 16,4 % | 0,9 % | 6,4 % | 6,7 % | 6,8 % |
| Käyttökate | 5 117,0 | 5 765,0 | 7 460,0 | 8 797,0 | 7 142,2 | 9 252,9 | 9 961,4 | 10 521,1 |
| EBIT (oik.) | 3 557,0 | 4 451,0 | 5 764,0 | 7 069,0 | 6 077,2 | 7 110,2 | 7 807,0 | 8 374,7 |
| EBIT | 3 880,0 | 4 468,0 | 5 863,0 | 6 973,0 | 5 177,2 | 7 110,2 | 7 807,0 | 8 374,7 |
| Tulos ennen veroja | 3 658,0 | 4 318,0 | 5 675,0 | 6 331,0 | 4 532,6 | 6 581,0 | 7 403,2 | 8 096,3 |
| Nettotulos | 2 866,0 | 3 320,0 | 4 351,0 | 4 785,0 | 3 520,5 | 5 126,0 | 5 770,7 | 6 314,2 |
| EPS (oik.) | 1,26 | 1,64 | 2,11 | 2,42 | 2,19 | 2,54 | 2,86 | 3,13 |
| kasvu-% | 14,5 % | 29,9 % | 28,7 % | 14,8 % | −9,4 % | 16,0 % | 12,6 % | 9,4 % |
| Osinko | 0,39 | 0,50 | 0,65 | 0,65 | 0,55 | 0,80 | 0,90 | 0,94 |
| Osingonjakosuhde | 27,3 % | 30,4 % | 30,1 % | 27,4 % | 31,5 % | 31,5 % | 31,4 % | 30,0 % |
Sisäänkirjautuminen vaadittu
Tämä sisältö on näkyvissä vain sisäänkirjautuneille käyttäjille
Kannattavuus ja pääoman tuotto
| 2020 | 2021 | 2022 | 2023 | 2024e | 2025e | 2026e | 2027e | |
|---|---|---|---|---|---|---|---|---|
| Käyttökate-% | 18,8 % | 18,7 % | 18,6 % | 18,9 % | 15,2 % | 18,5 % | 18,6 % | 18,4 % |
| EBIT-% (oik.) | 13,1 % | 14,4 % | 14,4 % | 15,2 % | 12,9 % | 14,2 % | 14,6 % | 14,7 % |
| EBIT-% | 14,3 % | 14,5 % | 14,6 % | 14,9 % | 11,0 % | 14,2 % | 14,6 % | 14,7 % |
| Oman pääoman tuotto-% | 16,3 % | 17,0 % | 17,6 % | 17,3 % | 12,4 % | 16,2 % | 16,2 % | 15,8 % |
| Sijoitetun pääoman tuotto-% | 14,1 % | 15,1 % | 16,7 % | 15,8 % | 10,6 % | 14,0 % | 14,8 % | 15,7 % |
Sisäänkirjautuminen vaadittu
Tämä sisältö on näkyvissä vain sisäänkirjautuneille käyttäjille
Arvostus
| 2020 | 2021 | 2022 | 2023 | 2024e | 2025e | 2026e | 2027e | |
|---|---|---|---|---|---|---|---|---|
| Osakekurssi (SEK) | 67,43 | 136,75 | 97,10 | 70,80 | 56,94 | 56,94 | 56,94 | 56,94 |
| Osakemäärä | 504,0 | 2 016,1 | 2 016,1 | 2 016,1 | 2 016,1 | 2 016,1 | 2 016,1 | 2 016,1 |
| Markkina-arvo | 33 983,3 | 275 697,6 | 195 760,4 | 142 737,8 | 114 795,0 | 114 795,0 | 114 795,0 | 114 795,0 |
| Yritysarvo | 39 191,3 | 280 733,6 | 202 086,4 | 159 975,8 | 130 145,4 | 126 182,7 | 122 125,3 | 118 020,7 |
| EV/S | 1,4 | 9,1 | 5,0 | 3,4 | 2,8 | 2,5 | 2,3 | 2,1 |
| EV/EBITDA | 7,7 | 48,7 | 27,1 | 18,2 | 18,2 | 13,6 | 12,3 | 11,2 |
| EV/EBIT (oik.) | 11,0 | 63,1 | 35,1 | 22,6 | 21,4 | 17,7 | 15,6 | 14,1 |
| EV/EBIT | 10,1 | 62,8 | 34,5 | 22,9 | 25,1 | 17,7 | 15,6 | 14,1 |
| P/E (oik.) | 53,5 | 83,5 | 46,0 | 29,2 | 26,0 | 22,4 | 19,9 | 18,2 |
| P/E | 47,4 | 83,0 | 45,0 | 29,8 | 32,6 | 22,4 | 19,9 | 18,2 |
| P/B | 1,9 | 12,9 | 7,0 | 5,2 | 3,9 | 3,4 | 3,0 | 2,7 |
| P/S | 1,3 | 8,9 | 4,9 | 3,1 | 2,4 | 2,3 | 2,1 | 2,0 |
| Osinkotuotto | 0,6 % | 0,4 % | 0,7 % | 0,9 % | 1,0 % | 1,4 % | 1,6 % | 1,7 % |
| Omavaraisuusaste | 46,3 % | 49,9 % | 51,8 % | 40,3 % | 44,6 % | 47,9 % | 52,9 % | 57,8 % |
| Nettovelkaisuusaste | 29,4 % | 23,3 % | 22,6 % | 62,9 % | 51,8 % | 33,8 % | 19,4 % | 7,6 % |
Sisäänkirjautuminen vaadittu
Tämä sisältö on näkyvissä vain sisäänkirjautuneille käyttäjille
Neljännesluvut
| Q1/23 | Q2/23 | Q3/23 | Q4/23 | 2023 | Q1/24e | Q2/24e | Q3/24e | Q4/24e | |
|---|---|---|---|---|---|---|---|---|---|
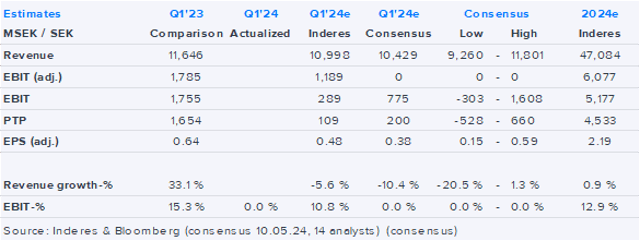
| Liikevaihto | 11 646,0 | 11 833,0 | 11 514,0 | 11 656,0 | 46 649,0 | 10 998,0 | 11 575,9 | 12 161,6 | 12 348,6 |
| Käyttökate | 2 153,0 | 2 243,0 | 2 309,0 | 2 092,0 | 8 797,0 | 724,1 | 1 926,9 | 2 209,3 | 2 281,8 |
| EBIT | 1 755,0 | 1 847,0 | 1 779,0 | 1 592,0 | 6 973,0 | 289,1 | 1 441,9 | 1 699,3 | 1 746,8 |
| Tulos ennen veroja | 1 654,0 | 1 701,0 | 1 598,0 | 1 378,0 | 6 331,0 | 109,1 | 1 271,9 | 1 539,3 | 1 612,2 |
| Nettotulos | 1 270,0 | 1 319,0 | 1 216,0 | 980,0 | 4 785,0 | 75,1 | 987,8 | 1 199,7 | 1 257,9 |
Sisäänkirjautuminen vaadittu
Tämä sisältö on näkyvissä vain sisäänkirjautuneille käyttäjille
NäytäKaikki sisältötyypit
NIBE Industries Q1 on Thursday: Continued low demand expected
Publication of NIBE Industrier's Annual Report for 2023
Liity Inderesin yhteisöön
Älä jää mistään paitsi – luo käyttäjätunnus ja ota kaikki hyödyt irti Inderesin palvelusta.
FREE-tili
Pörssin suosituin aamukatsaus
Analyytikon kommentit ja suositukset
Osakevertailu
PREMIUM-tili
Kaikki yhtiöraportit ja sisällöt
Premium-työkalut (mm. sisäpiirin kaupat ja screeneri)
Mallisalkku
NOTICE OF THE ANNUAL GENERAL MEETING
NIBE gives notice of redundancy to 340 employees in Sweden

Short-term slowdown in a long-term growth market
Good performance in 2023 – clear decline in fourth quarter
Short-term headwinds stronger than expected
NIBE Industrier AB (publ) appoints Fredrik Erlandsson as Head of Corporate Communications and Investor Relations
Klas Dahlberg moving on to Hexpol
NIBE acquires a minor yet strategic addition to its Element business
NIBE acquires a minor yet strategic addition to its Element business
NIBE acquires Danish LS Control A/S

Risks cast a shadow over potential rewards
Risks cast a shadow over potential rewards
Correction: Continued good sales and earnings performance
Continued good sales and earnings performance
NIBE Industries Q3 on Wednesday: With growth towards calmer markets
